Call Data (preview)
Overview
Call Data is the reporting workspace in the myCloudPBX Service Portal, switched on by the Early Adopter Program.
It has five entries in the menu, all on one page: Overview, Calls, Call reports, People reports and Scheduled. The breadcrumb at the top of the page names the one you are in.
The window picker. At the top right of Overview, Calls and the report screens you choose the period: 'Today', '7 days', '30 days', 'This month' or 'Custom'. One choice applies across the whole workspace, so the Overview, the Calls list and any report you open all describe the same days. Scheduled reports are the exception, because each run works out its own window.
This feature is on preview
Reports here will not match the existing Reporting Dashboard exactly while both are running. That is expected during the preview. Not every report has moved across yet, so use whichever portal has the report you need.
Overview
Overview draws the headline answers for the window from across the report catalogue.
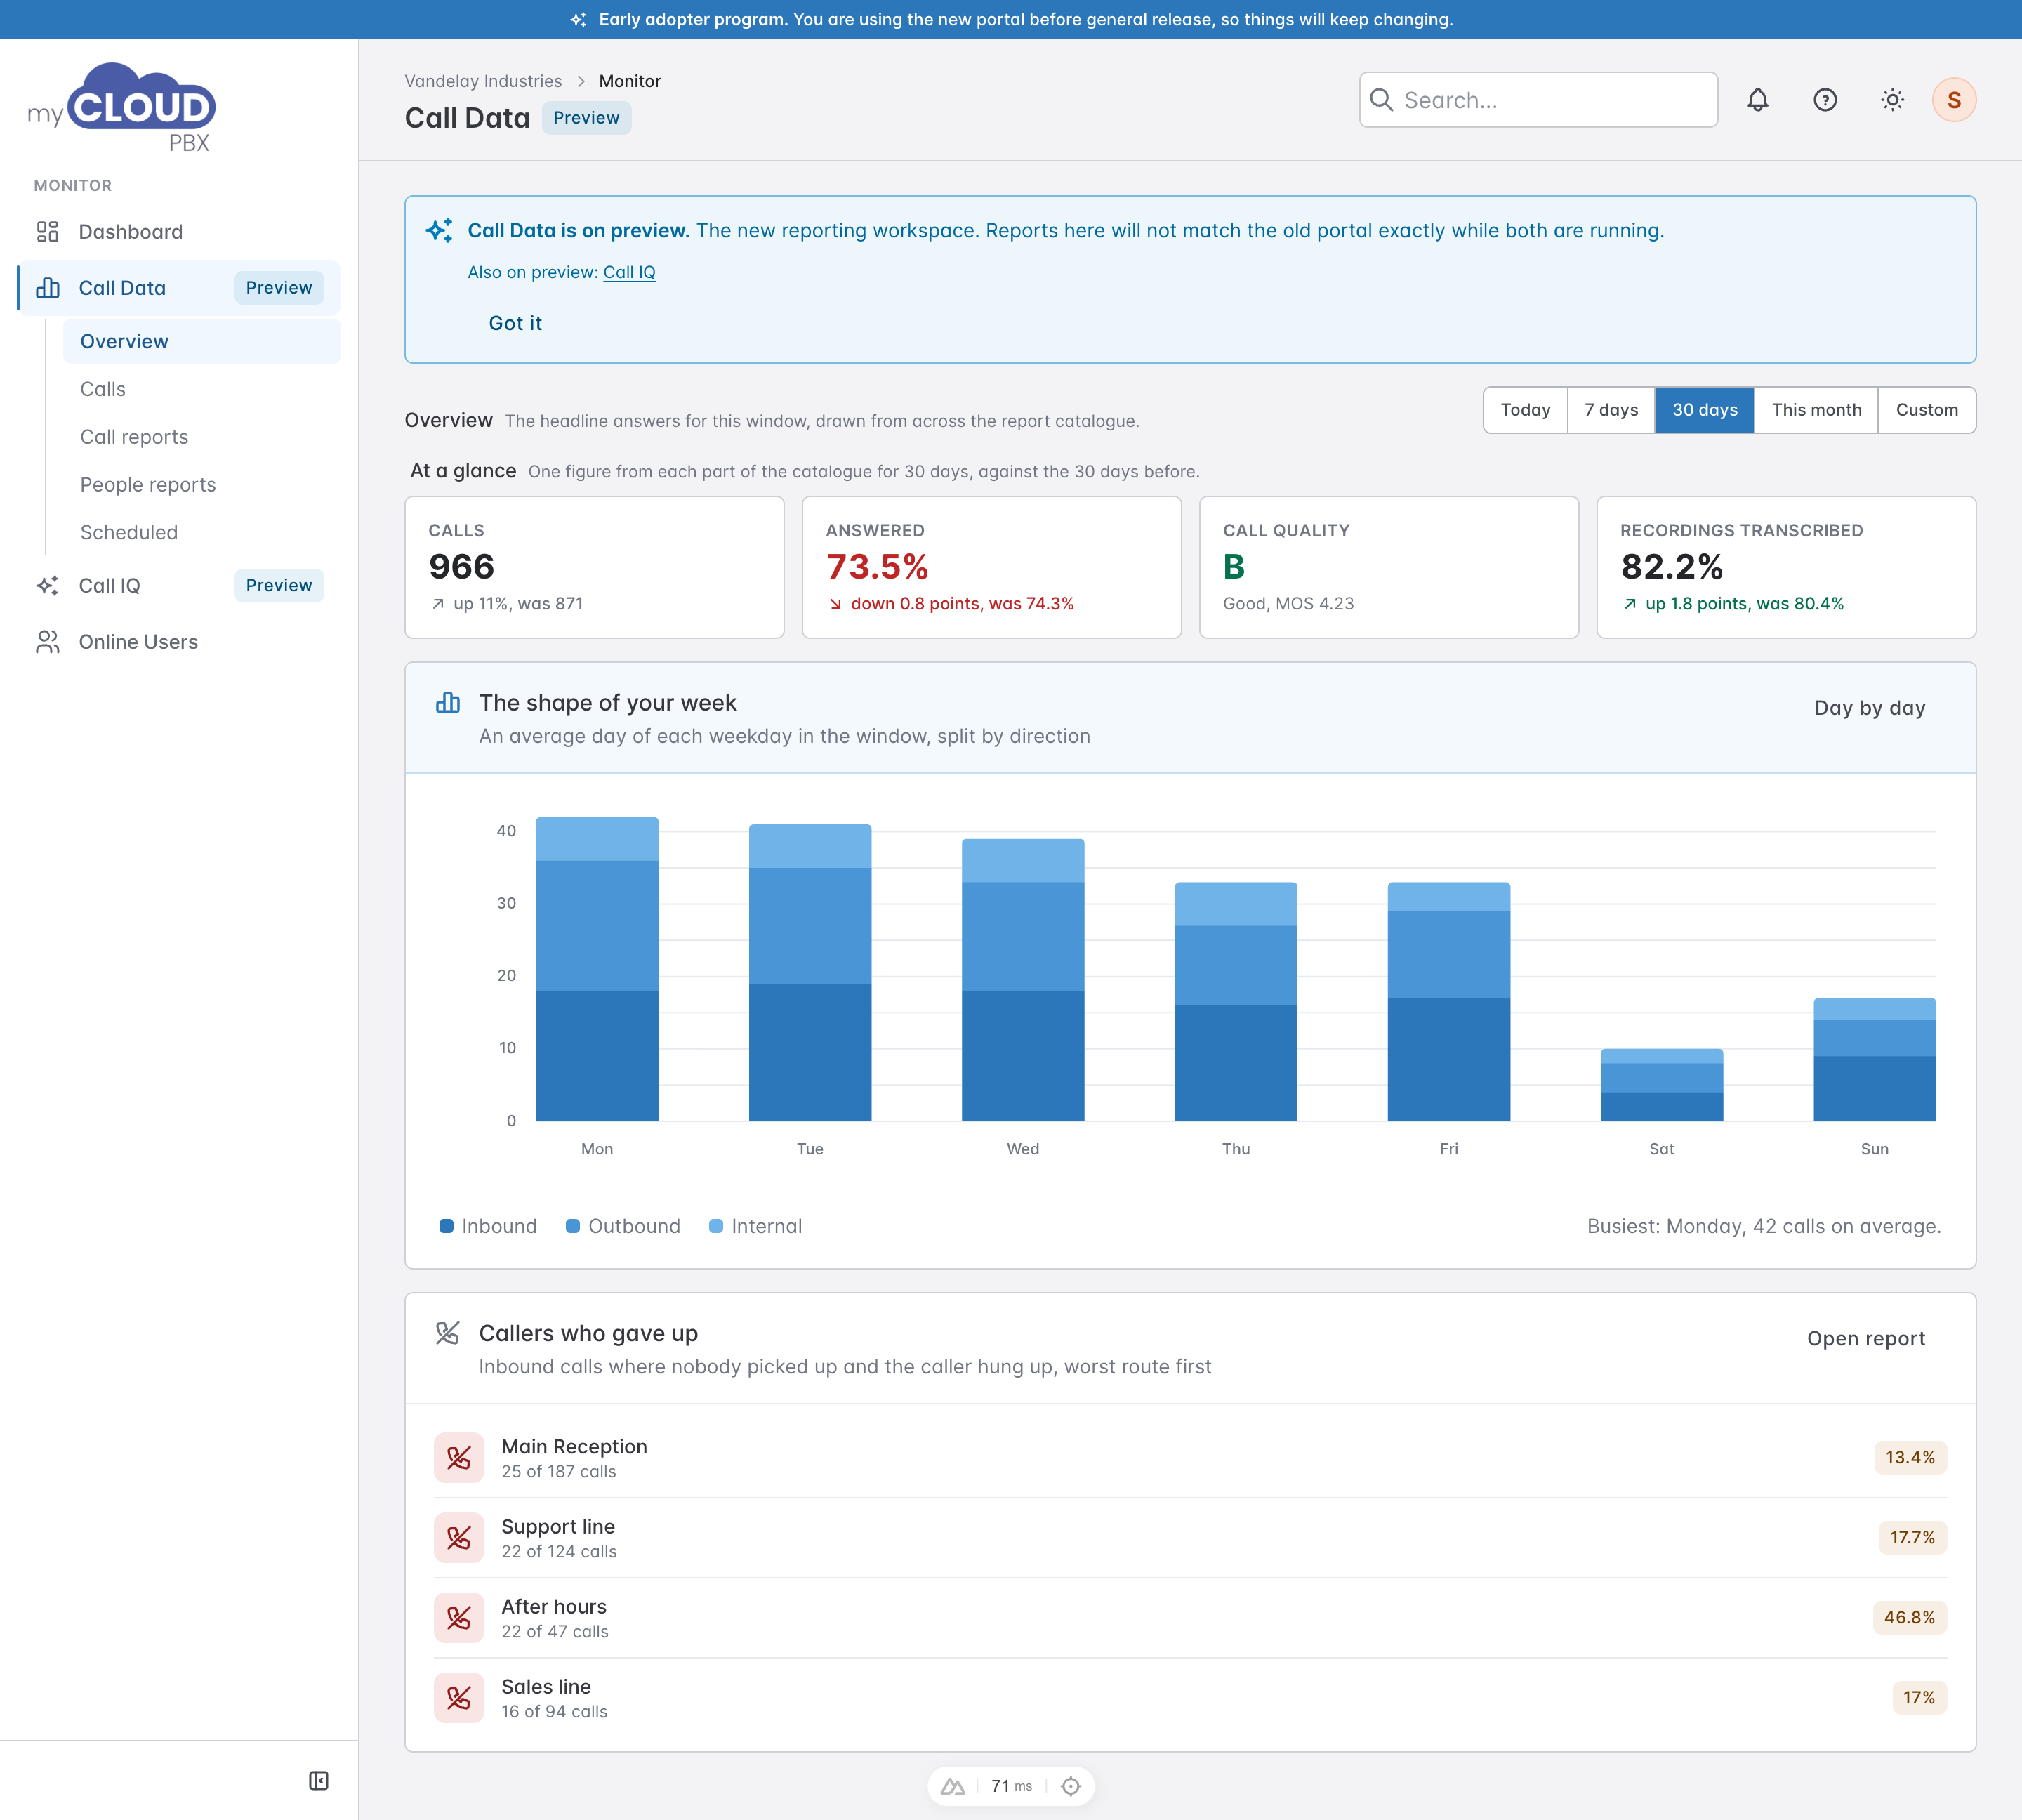
At a glance. Total calls, the answered percentage, the call quality grade with its MOS score, and the share of recordings transcribed. Calls, answered and transcribed each say how they moved against the same length of time before, for example 'up 9%, was 190'.
Calls by day of the week. Calls on an average day of each weekday, stacked by direction, so you can see where the load falls. The caption names the busiest day. With the window set to 'Today' the panel becomes Today by the hour and names the busiest hour instead. 'Day by day' opens the Call Activity report, which shows each date.
Callers who gave up. Inbound calls where nobody picked up and the caller hung up, worst route first. Each route shows how many of its calls were abandoned and the abandonment rate. Click a route, or 'Abandoned Calls by Route' at the top of the panel, to open the full report.
Calls
Calls lists every call in the window with the journey behind each one.
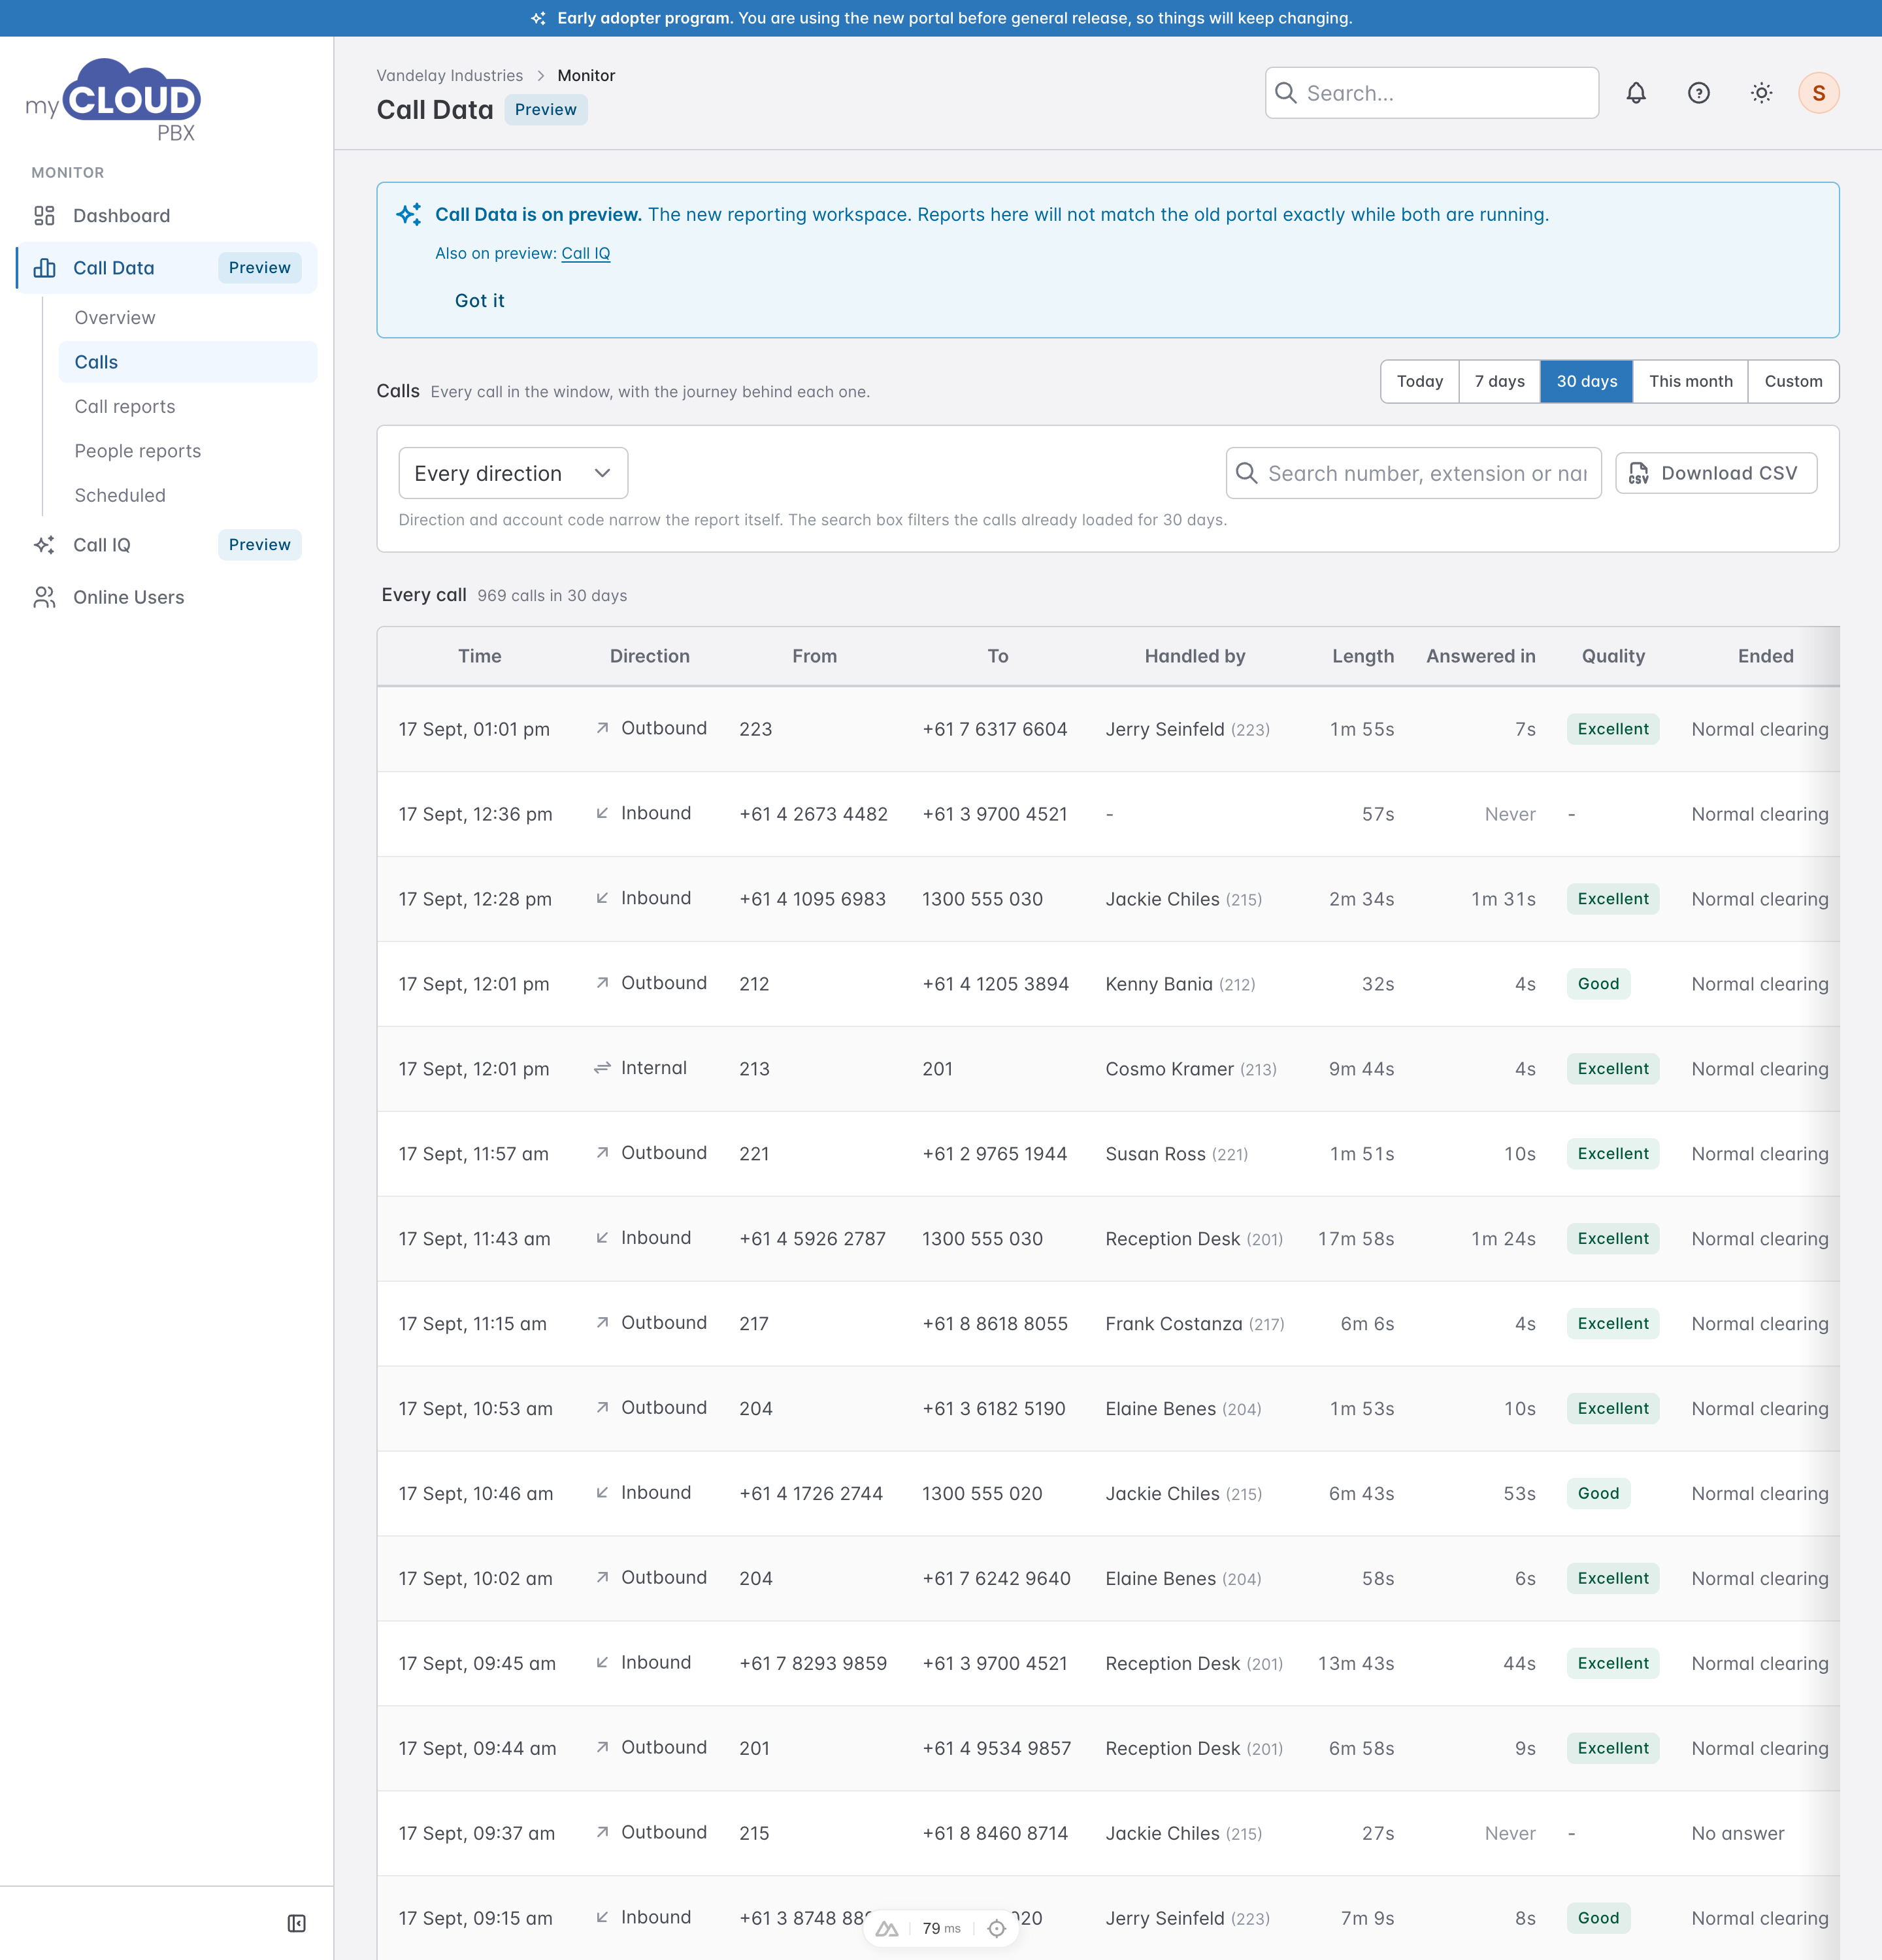
Filter by direction with 'Every direction', 'Inbound only' or 'Outbound only'. The search box filters the calls already on screen by number, extension or name. 'Download CSV' saves the list.
| Column | What it shows |
|---|---|
| Time | The date and time the call started. |
| Direction | Inbound, Outbound or Internal. |
| From and To | The numbers or extensions at each end. |
| Handled by | The person and extension who took the call. A dash means nobody did. |
| Length | How long the call lasted. |
| Answered in | How long the call took to answer. 'Never' means it was not answered. |
| Quality | A grade of how the line sounded: Excellent, Good or Fair. |
| Ended | How the call ended. Normal clearing means it finished normally, with one side hanging up. |
Click anywhere on a row to open 'What happened on this call', the step by step journey of the call. 'Open in Call IQ for the recording and transcript' at the bottom takes you to the same call in Call IQ.
Call reports
Call reports are the reports about routes, queues and the calls themselves.
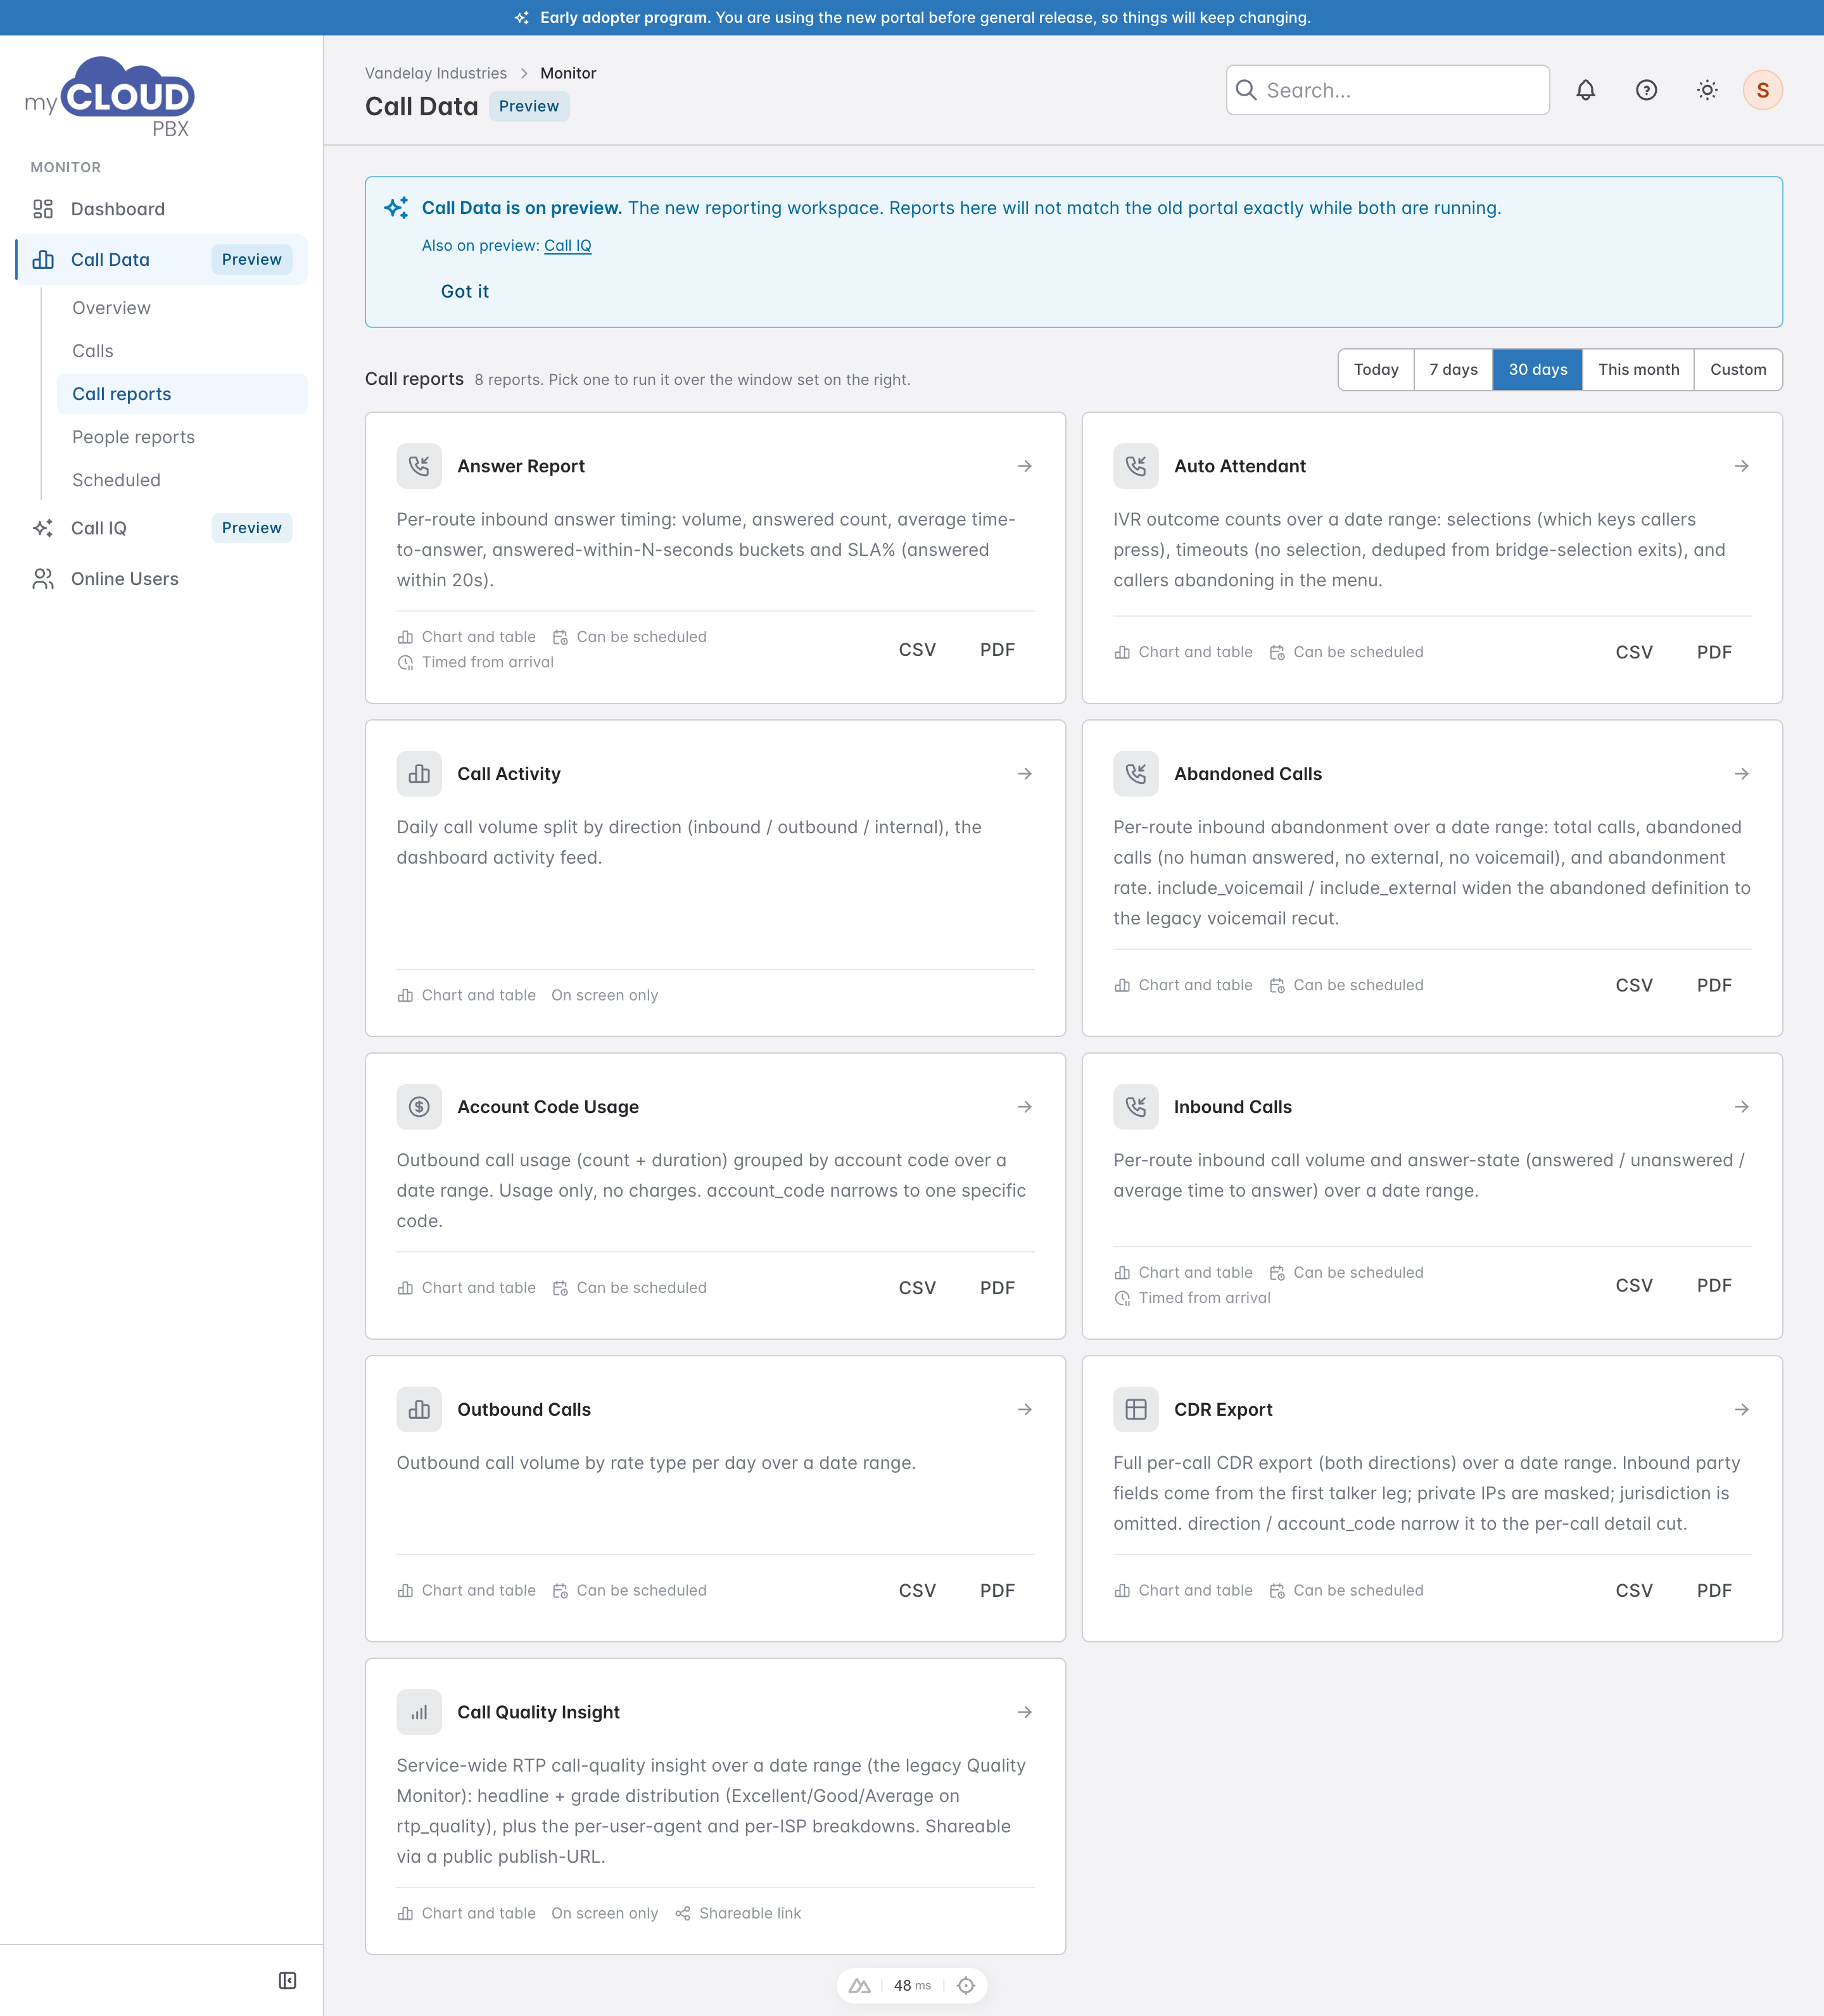
Each card describes one report and what it can do.
| Label | Meaning |
|---|---|
| Chart and table | The report draws a chart as well as listing rows. |
| Table | Rows only. |
| Can be scheduled | It can be emailed on a schedule. See Scheduled below. |
| On screen only | It cannot be scheduled. |
| Timed from arrival | Its timings count from when the call reached the phone system, so greetings and menus are included. |
| CSV and PDF | Download the report for the current window without opening it. |
The call reports in this release:
- Answer Report. How quickly each route answers: volume, answered count, average time to answer, how many were answered within 15, 20 and 30 seconds, and the share answered within 20 seconds.
- Auto Attendant. What callers did in your menus: which keys they pressed, how many timed out, and how many hung up in the menu.
- Call Activity. Daily call volume split by direction. The same data as the Dashboard's activity chart.
- Abandoned Calls by Route. Per route, how many inbound callers hung up before anyone answered, and the rate. Options let you count voicemail and external forwards as abandoned.
- Account Code Usage. Outbound calls and duration grouped by account code. Usage only, no charges.
- Inbound Calls. Per route inbound volume, answered against unanswered, and average time to answer.
- Outbound Calls. Outbound volume by rate type per day.
- CDR Export. The full per call record for both directions, for anyone who needs the raw data.
- Call Quality Insight. Service wide call quality: the headline grade, the spread of grades, and breakdowns by handset type and by internet provider.
- Abandoned Calls. The call back list. Callers whose missed inbound call was never returned with an outbound call to their number within the callback window, which is 24 hours unless you change it.
Click a card, or its arrow, to run the report.
Running a report
An open report has the same shape whichever one you pick.
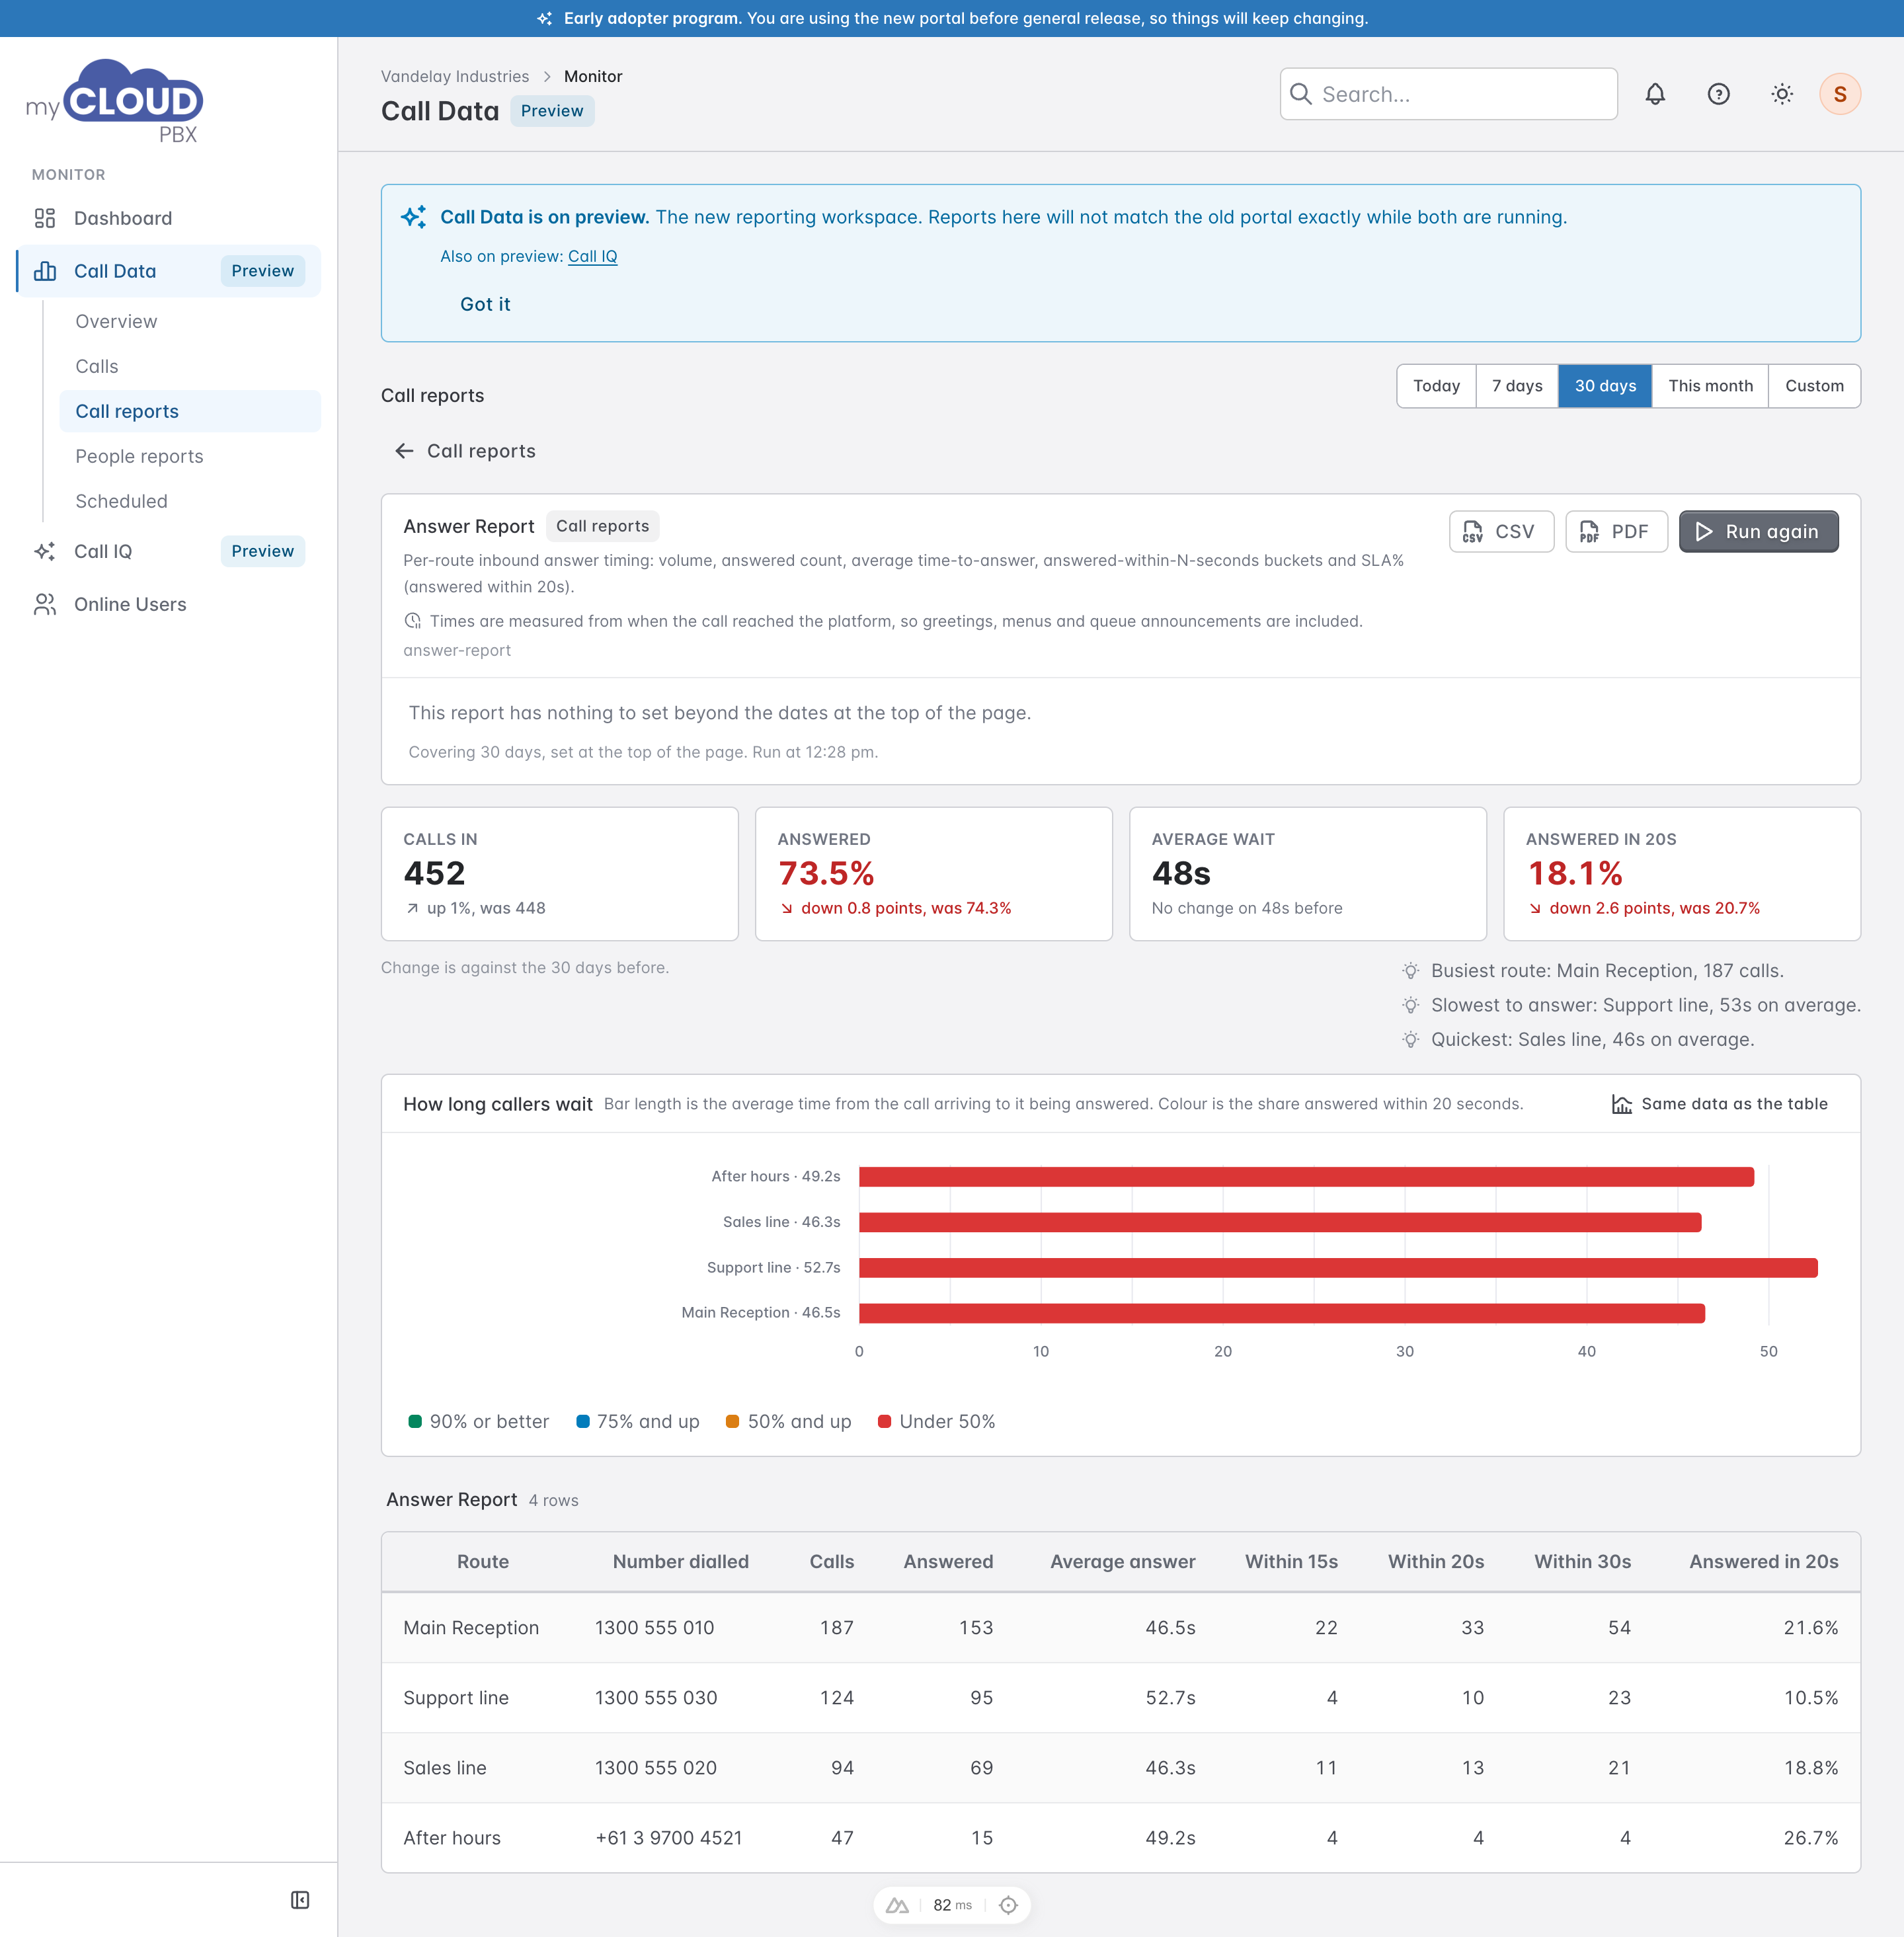
- The header names the report, its family and what it measures. Reports timed from arrival say so beneath. 'CSV' and 'PDF' download it. 'Run again' refreshes it.
- Settings. Some reports have options beyond the dates, such as which weekdays or hours to include. Others say "This report has nothing to set beyond the dates at the top of the page." The line beneath confirms the window and when it was run.
- Tiles give the headline figures for the window, each against the period before, for example 'up 15%, was 92'.
- Findings beneath the tiles pick out what stands out: the busiest route, the slowest to answer, the quickest.
- The chart draws the same data as the table. In the Answer Report, bar length is the average wait and colour is the share answered within 20 seconds (90% or better, 75% and up, 50% and up, or under 50%).
- The table lists every row. Click a heading to sort.
'Call reports' (or 'People reports') with the back arrow above the report returns you to the list.
People reports
People reports are the reports about extensions and the people on them.
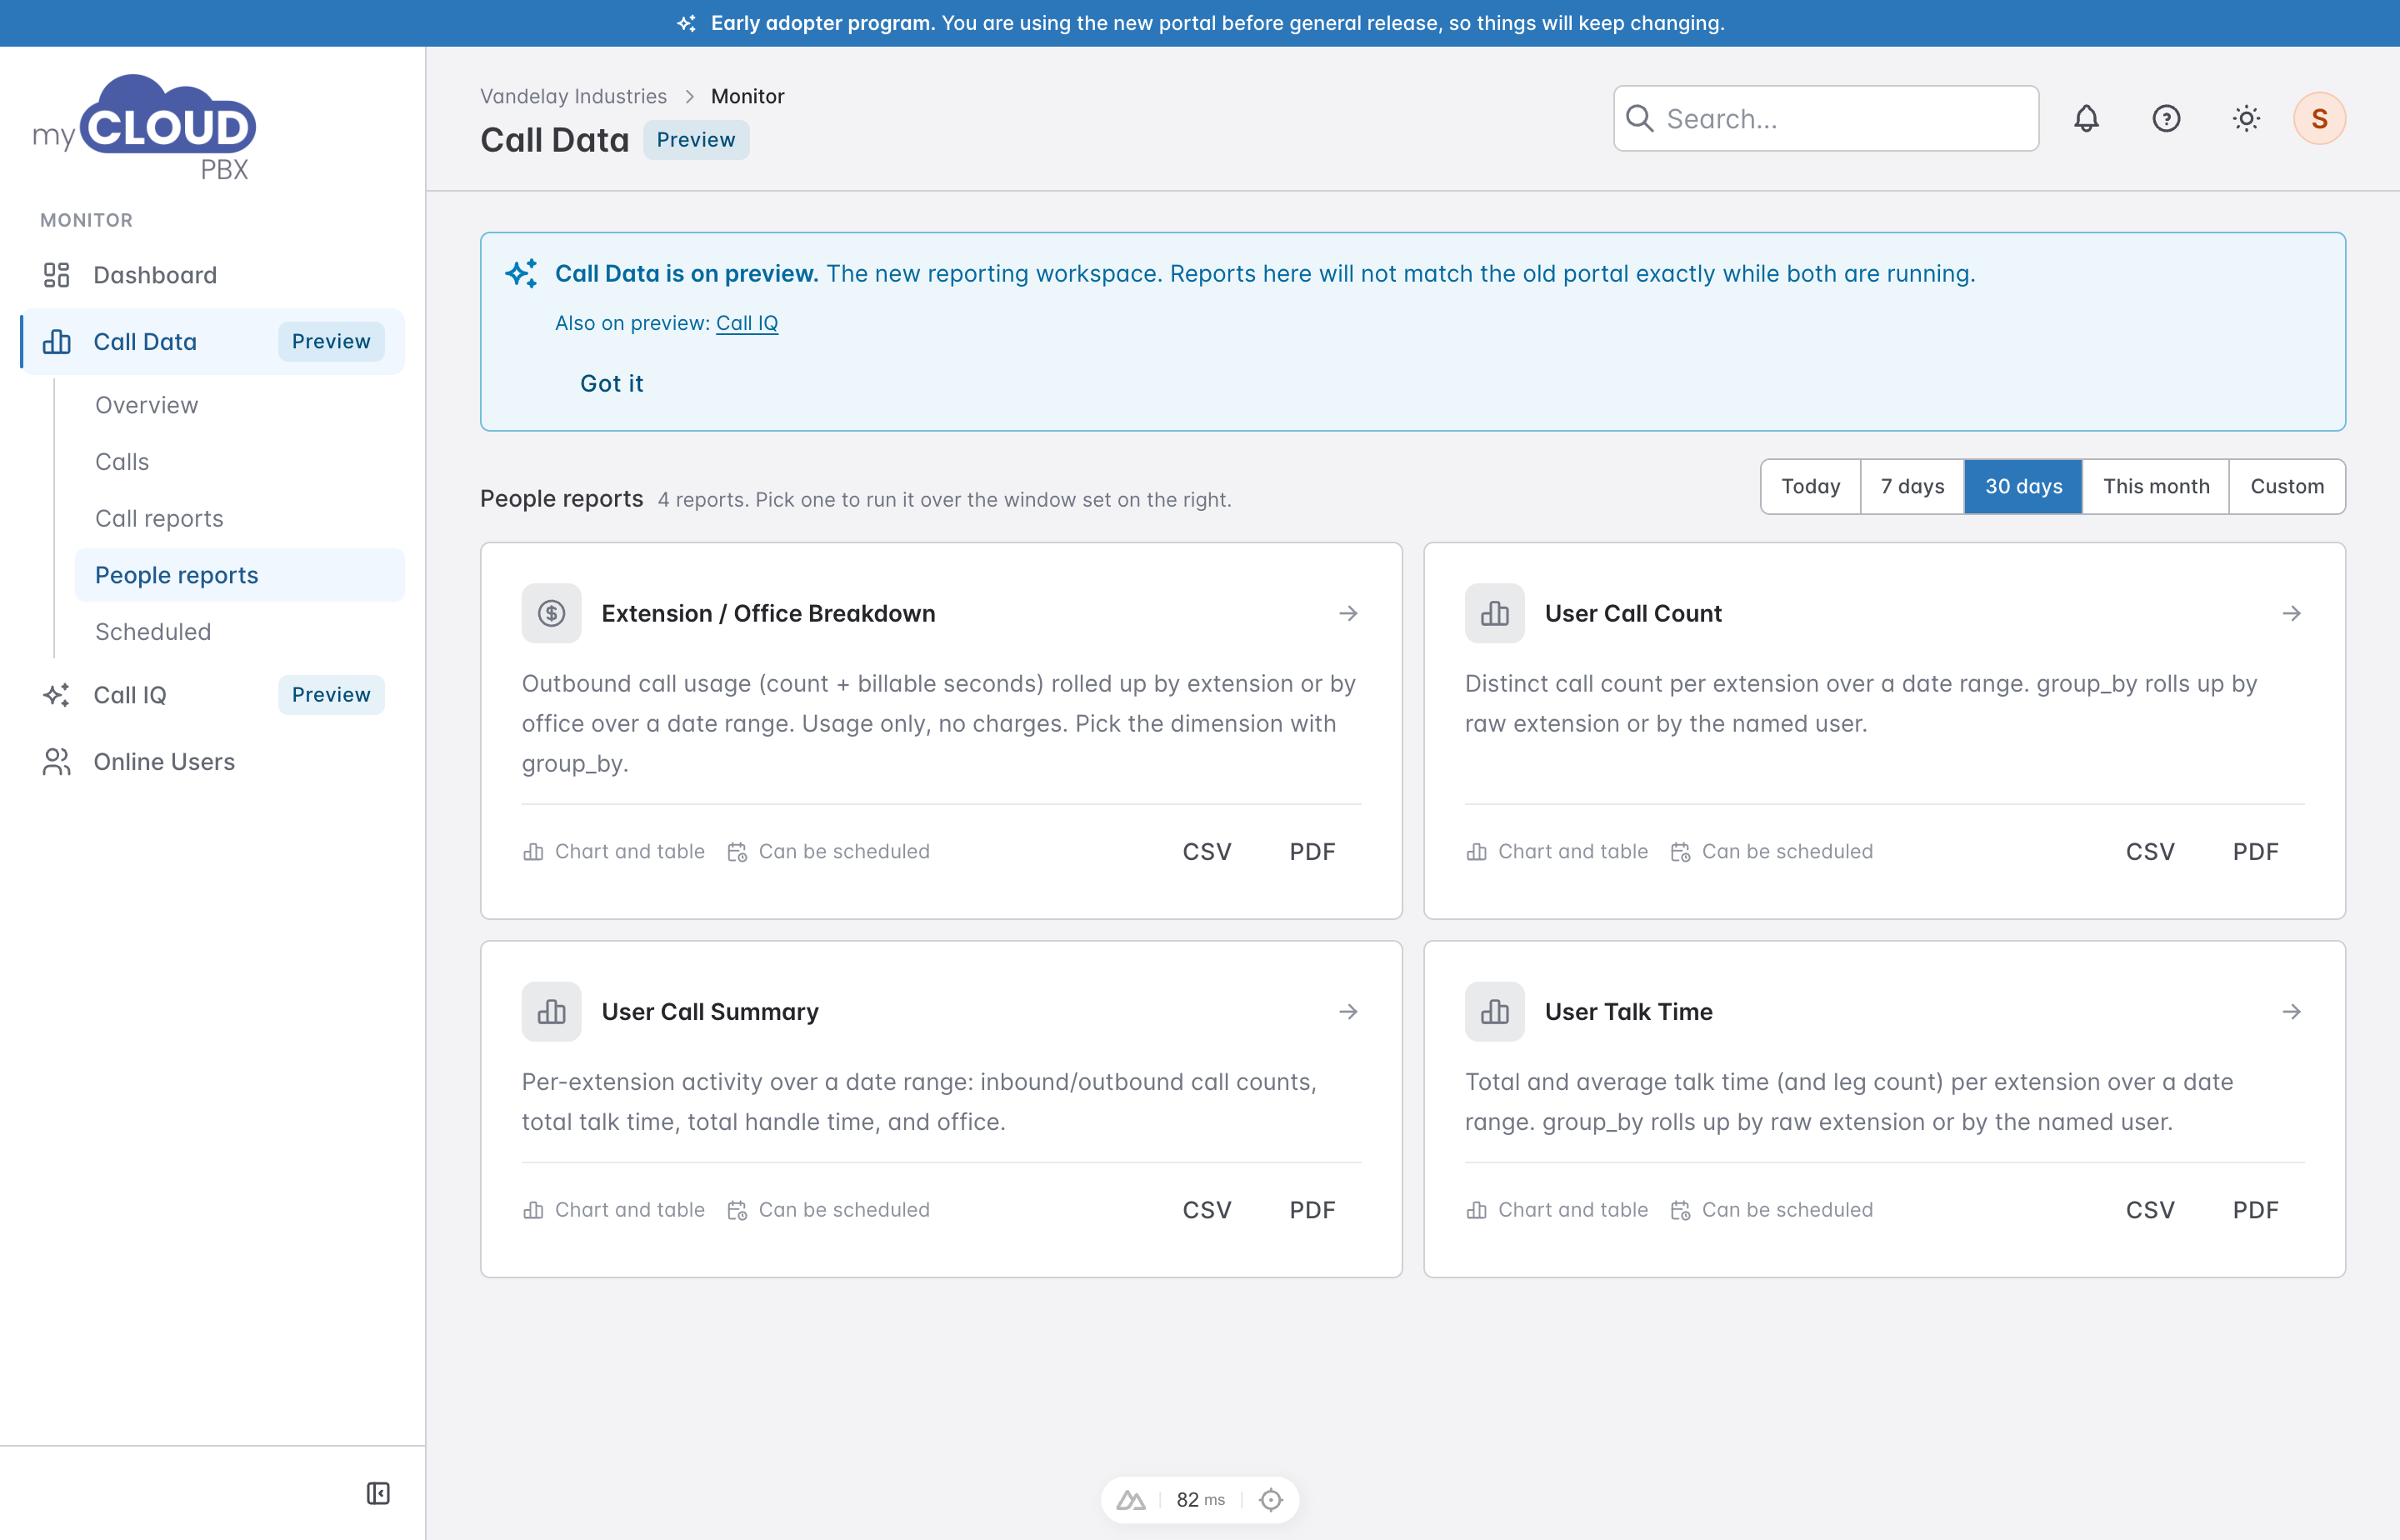
- Extension / Office Breakdown. Outbound usage (calls and talk time) rolled up by extension and office. Usage only, no charges.
- User Call Count. Distinct calls per extension.
- User Call Summary. Per extension activity: inbound and outbound counts, total talk time, total handle time and office.
- User Talk Time. Total and average talk time per extension.
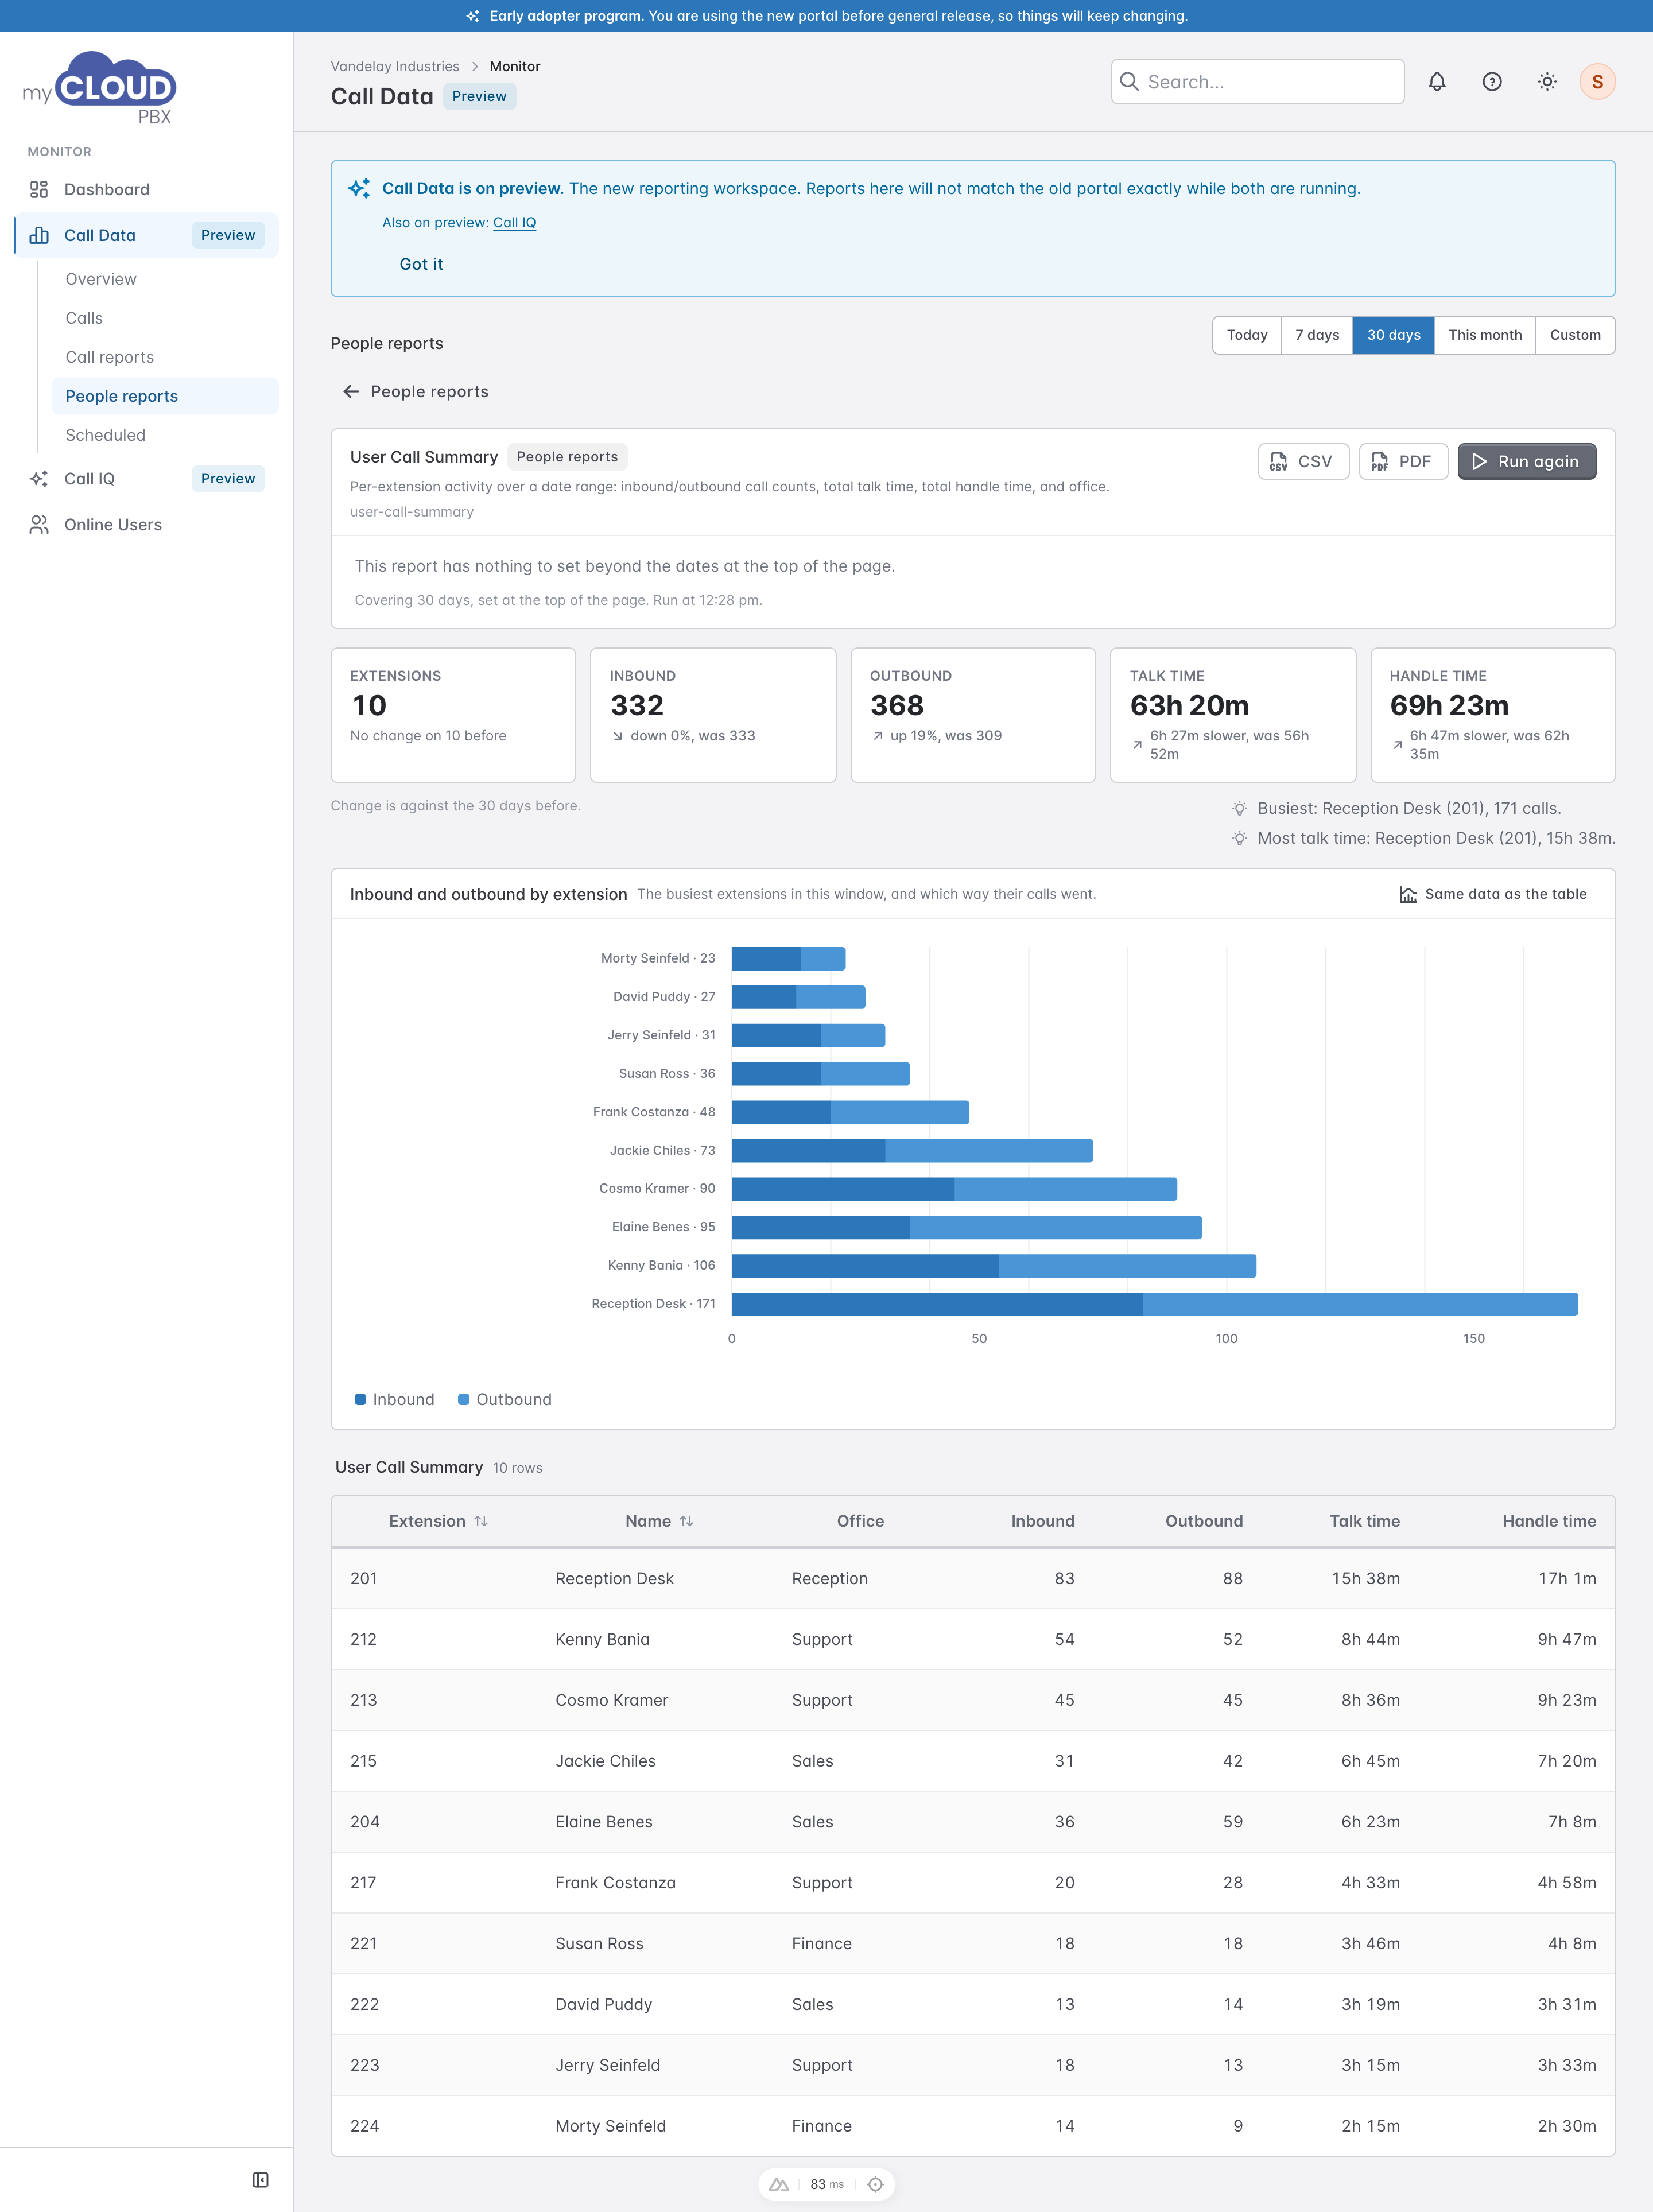
The User Call Summary above is typical: headline tiles, the busiest extension and the one with the most talk time picked out, a chart of inbound and outbound calls by person, and the full table underneath.
Scheduled
Scheduled is where reports send themselves.
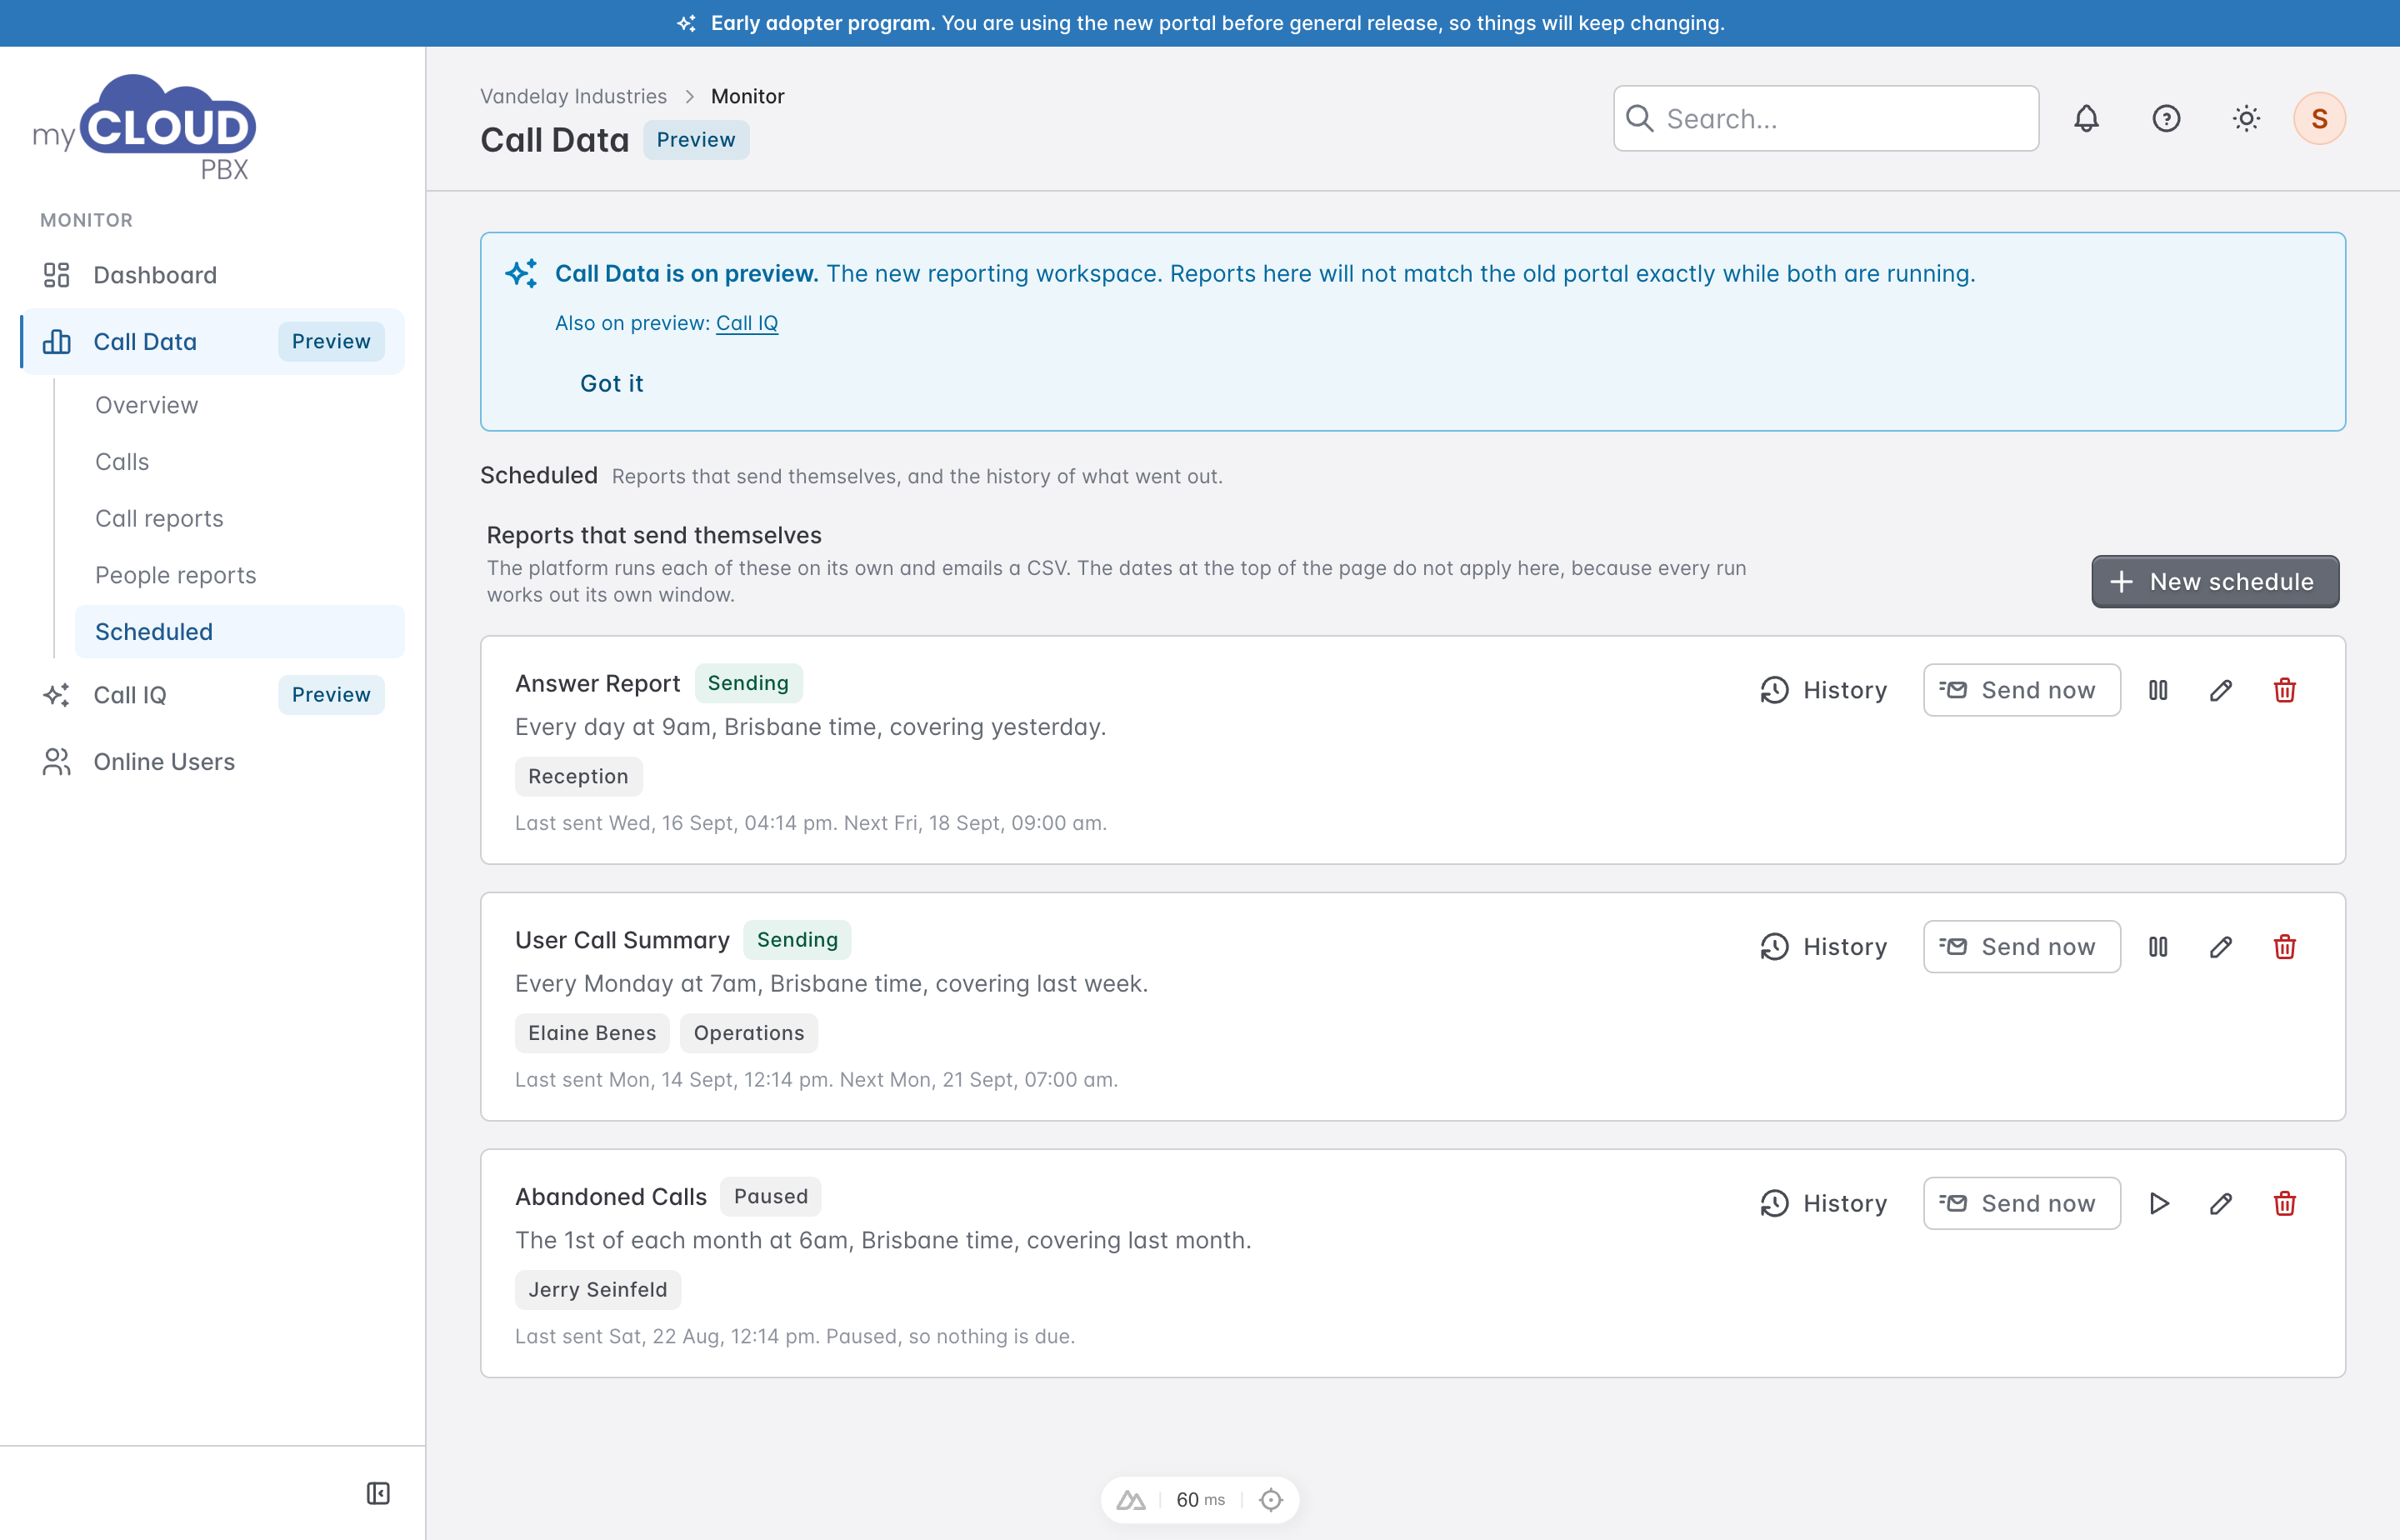
Each schedule shows which report goes out, how often and when, which window each run covers, who receives it, when it last went and when it goes next. A Sending badge means it is live. Paused means it is not.
Live changes. Scheduled opens read only, so nothing can be sent or changed by accident. To create, edit, pause or send a schedule, turn on the switch in the 'Viewing live schedules' notice at the top. While it is on, anything you do happens on the platform straight away.
On each schedule:
- 'History' lists every run so far and whether it was delivered.
- 'Send now' runs it immediately without waiting for the next slot, and emails every recipient straight away.
- The pause and play icons pause and resume it.
- The pencil edits it. The bin deletes it.
'New schedule' opens the form.
- Pick the Report. Only reports that can be scheduled are listed.
- Choose what each run is Covering: yesterday, last week, last month, this month so far, or the last 7 days.
- Choose How often (every day, every week or every month), Which day (a weekday, or a day of the month from 1 to 28 so every month has one), the hour and the Timezone.
- Set any options the report has, such as which weekdays or hours to include.
- Under Send it to, add each recipient's name and email address.
Each run works out its own window fresh, and the platform emails a CSV.